
Episode 18 - Benchmarking AWS Flow Logs
Welcome to Episode 18 of the “Head in the Clouds” Video Series. I am Ken Hartman, a SANS Certified Instructor and content creator for the SANS Cloud Security Curriculum.
Today’s episode is titled: “Benchmarking AWS Flow Logs”
In many of the of the courses in the SANS Cloud Curriculum, we will have one or more labs that involves flow logs. However, a portion of the lab time is spent waiting for the flow logs to get provisioned. It’s kind of like watching and waiting for water to boil. Then, once the flow logs are provisioned, it takes time for the measured traffic to show up. Therefore, I thought it would be very interesting to determine what one should expect via experimentation and observation. Along the way, I made some very interesting discoveries, and I cannot wait to show them to you.
Objectives
Anytime we use a tool, technique, or service, we should be aware of its limitations and possible pitfalls. As such, here are the objectives for today:
- Experimentally determine the typical time to provision flow logs to an S3 bucket.
- Experimentally determine the typical time to provision flow logs to a CloudWatch logs group.
- Experimentally determine the typical delay for ongoing traffic to be captured in the flow log record.
- Contemplate the implications of our findings.
Setup
For this episode, we will assume that you have an AWS EC2 virtual machine running in a VPC that has a “Name” tag of “hitc-vpc.” The t2.micro type that is in the free tier will do just fine. I recommend that you use the Ubuntu 20.04 AMI for your region, as this will allow me to provide you with the exact commands to install some additional software later in this episode.
I used Terraform to deploy my environment as described in the HitC Episode titled Episode 10 - Demonstration of Terraform Modules; Deploy a VM in AWS, Azure and GCP at once as I had originally planned to benchmark all three cloud service providers. However, as I got deeper and deeper into my research into AWS flow logs, I decided to stay focused on just AWS and may circle back to Azure and GCP flow logs in one or more future episodes.
In this episode, we will be making extensive use of the AWS command line interface. This has two benefits:
- It will make it very easy for you to reproduce my work, and
- It will allow us to measure the time that it takes for things to happen.
The machine on which you are running the CLI commands will need jq in addition to the AWS command line interface.
OBJECTIVE 1: Experimentally determine the typical time to provision flow logs to an S3 bucket
To start with, we need to set some variables that will be used by our commands:
UNIQ_ID=$RANDOM; echo $UNIQ_ID
ACCOUNT=$(aws sts get-caller-identity | jq -r .Account); echo $ACCOUNT
YYYY=$(date -Idate | cut -d"-" -f1); echo $YYYY
MM=$(date -Idate | cut -d"-" -f2); echo $MM
DD=$(date -Idate | cut -d"-" -f3); echo $DD
REGION=$(aws ec2 describe-availability-zones --output text --query 'AvailabilityZones[0].[RegionName]'); echo $REGION
We generate a unique ID to ensure that the S3 bucket that we create is unique. Linux has a variable called $RANDOM that we can use for this purpose.
The YYYY, MM, and DD are captured so we can look into the bucket for our data.
Lastly, we use a trick from StackOverflow.com to get the region, as yours may be different from mine.
Next, we will create a variety of “helper commands.”
Get the VPC ID
To get the VPC ID of the VPC that is named “hitc-vpc” we can use:
VPC_ID=$(aws ec2 describe-vpcs --filters Name=tag:Name,Values=hitc-vpc --query "Vpcs[0].VpcId" --output text); echo $VPC_ID
Create the Bucket for the Flow Logs
Next, we need to create an S3 bucket to receive our flow logs:
aws s3 mb s3://hitc-benchmark-flowlogs-$UNIQ_ID
Set up the Flow Logs for the VPC and Send to S3
Our next task is to make sure we have the command to set the flow logs for the VPC and send them to S3:
aws ec2 create-flow-logs \
    --resource-type VPC \
    --resource-ids $VPC_ID \
    --traffic-type ALL \
    --log-destination-type s3 \
    --log-destination arn:aws:s3:::hitc-benchmark-flowlogs-$UNIQ_ID \
    --max-aggregation-interval 600 \
    --tag-specifications 'ResourceType=vpc-flow-log,Tags=[{Key=Name,Value=hitc-flow-log}]'
Describe the Flow Logs for the VPC
Having done that, we may find it helpful to be able to describe the flow logs for the VPC in question:
aws ec2 describe-flow-logs --filter "Name=resource-id,Values=$VPC_ID"
Delete the Flow Logs for the VPC
Next, we need to be able to delete the flow logs that we just created. To do this we need to know the Flow Log ID.
FLOW_LOG_ID=$(aws ec2 describe-flow-logs --filter "Name=resource-id,Values=$VPC_ID" --query 'FlowLogs[0].FlowLogId' --output text)
echo $FLOW_LOG_ID
aws ec2 delete-flow-logs --flow-log-ids $FLOW_LOG_ID
List the contents of the Bucket
To verify the presence of a flow log, we will need to be able to drill deep into the S3 bucket. This is facilitated by the variables we set earlier.
aws s3 ls s3://hitc-benchmark-flowlogs-$UNIQ_ID/AWSLogs/$ACCOUNT/vpcflowlogs/$REGION/$YYYY/$MM/$DD/
Empty the Bucket
We also need the ability to empty the bucket between successive iterations of our test:
aws s3 rm s3://hitc-benchmark-flowlogs-$UNIQ_ID --recursive
Remove the Bucket
It is also good idea to remove the bucket when we are done with our testing:
aws s3 rb s3://hitc-benchmark-flowlogs-$UNIQ_ID
Generate Flow Log Traffic
Now that we’ve got our helper scripts figured out and tested, we need to generate some traffic to get captured by our flow log. SSH into your easy to instance and run the following command:
while true ; do wget --timeout=10 http://1.1.1.1:81; sleep 20; done
Note that I selected CloudFlare as the target as they are big enough that this would not be considered abusive and by sending the traffic to port 81, the retries will keep working until exhausted after 20 attempts and will then start over after 20 seconds. Anything that repetitively generates traffic will work here.
TEST 1 - Time the provisioning of the flow Log until first flow log record in S3
With that done, we can now measure the time between the provisioning of the flow log until first flow log record in S3. Every 20 seconds we will check the S3 bucket to see if the flow log showed up yet. Our “TEST” checks to see if the length of response of the aws s3 ls command is zero. Once there is a flow log record in the bucket, the infinite loop will exit and we subtract the start time from the end time. Working in epoch time, makes this easy.
NOTE: This assumes that the S3 bucket exists, but is empty
# Set up the Flow Logs for the VPC
aws ec2 create-flow-logs \
    --resource-type VPC \
    --resource-ids $VPC_ID \
    --traffic-type ALL \
    --log-destination-type s3 \
    --log-destination arn:aws:s3:::hitc-benchmark-flowlogs-$UNIQ_ID \
    --max-aggregation-interval 600 \
    --tag-specifications 'ResourceType=vpc-flow-log,Tags=[{Key=Name,Value=hitc-flow-log}]'
# Watch for initial flow logs
printf "Waiting for the flow logs to apear in S3 bucket "
START_TIMER=$(date +%s)
TEST=""
while [ -z "$TEST" ] ; do
  printf "."
  sleep 20
  TEST=$(aws s3 ls s3://hitc-benchmark-flowlogs-$UNIQ_ID/AWSLogs/$ACCOUNT/vpcflowlogs/$REGION/$YYYY/$MM/$DD/)
done
STOP_TIMER=$(date +%s)
echo "DONE"
echo $((STOP_TIMER-START_TIMER))" seconds have elapsed"
While this script executes, it will print a dot to stdout every 20 seconds. When it is done, the output will look like this:
772 seconds have elapsed
Ok, 772 seconds is 12.87 minutes. We now have our TEST 1 measurement. Note that this can be off by 20 seconds due to the sleep timer, which can be removed.
Tear down TEST 1
To repeat the test, we need to delete the flow log and empty the S3 bucket, but leave the S3 bucket in place.
# Delete the Flow Logs for the VPC
FLOW_LOG_ID=$(aws ec2 describe-flow-logs --filter "Name=resource-id,Values=$VPC_ID" --query 'FlowLogs[0].FlowLogId' --output text)
echo $FLOW_LOG_ID
aws ec2 delete-flow-logs --flow-log-ids $FLOW_LOG_ID
# Empty the Bucket
aws s3 rm s3://hitc-benchmark-flowlogs-$UNIQ_ID --recursive
TEST 1 Summary
This table shows the results of repeating the test 3 more times:
| Script Results | Minutes |
|---|---|
| 772 seconds have elapsed | 12.86 Minutes |
| 417 seconds have elapsed | 6.97 Minutes |
| 813 seconds have elapsed | 13.55 Minutes |
| 960 seconds have elapsed | 16.00 Minutes |
Wow, it can take 16 minutes to get your first flow logs!
So, what is up with this? Well, the catch phrase that the cloud service providers use is eventual consistency. We know that the big guys use queuing and focus intently on optimization, so I am guessing that it is for those reasons that there is a provisioning delay.
Final Cleanup TEST 1
Now that we have obtained our results, make sure that you delete the flow log and empty the bucket again, using the last set of commands and then remove the bucket, as we no longer need it.
# Remove the Bucket
aws s3 rb s3://hitc-benchmark-flowlogs-$UNIQ_ID
OBJECTIVE 2: Experimentally determine the typical time to provision flow logs to a Cloud Watch logs group
Now, let’s take a look at Flow Logs sent to Cloud Watch Logs.
Create the CloudWatch Logs Group
First we need to create the CloudWatch Logs Group:
aws logs create-log-group --log-group-name hitc-flow-logs
Delete the Log Group
And, here is the corresponding command to delete the log group:
aws logs delete-log-group --log-group-name hitc-flow-logs
Create the CloudWatch Logs Role
Next, we need create the CloudWatch Logs Role. To do this we will create the Trust Policy JSON file, the Permissions Policy JSON file, and then attach them to a new role.
Create the Trust Policy JSON file. I like to use the “heredoc” technique, so that everything can be scripted:
cat << EOF > trust-policy.json
{
  "Version": "2012-10-17",
  "Statement": [
    {
      "Effect": "Allow",
      "Principal": {
        "Service": "vpc-flow-logs.amazonaws.com"
      },
      "Action": "sts:AssumeRole"
    }
  ]
}
EOF
Create the Permissions Policy JSON file:
cat << EOF > cw-flow-logs-policy.json
{
  "Version": "2012-10-17",
  "Statement": [
    {
      "Effect": "Allow",
      "Action": [
        "logs:CreateLogGroup",
        "logs:CreateLogStream",
        "logs:PutLogEvents",
        "logs:DescribeLogGroups",
        "logs:DescribeLogStreams"
      ],
      "Resource": "*"
    }
  ]
}
EOF
Next, run the following commands to create the policies and the role:
aws iam create-policy --policy-name hitc-cw-flow-logs --policy-document file://cw-flow-logs-policy.json
aws iam create-role --role-name hitc-cw-flow-logs --assume-role-policy-document file://trust-policy.json
aws iam attach-role-policy --policy-arn "arn:aws:iam::$ACCOUNT:policy/hitc-cw-flow-logs" --role-name hitc-cw-flow-logs
aws iam list-attached-role-policies --role-name hitc-cw-flow-logs
TEST 2 - Time the provisioning of the flow Log until first flow log record in CloudWatch
With our setup for Test 2 in place, we can now conduct it. This “TEST” checks to see if the length of response of the aws logs describe-log-streams command is zero. Once there is a flow log record in CW logs, the infinite loop will exit and we subtract the start time from the end time.
NOTE: This assumes that the CloudWatch Log Group exists, but is empty.
# Set up the Flow Logs for the VPC
aws ec2 create-flow-logs \
    --resource-type VPC \
    --resource-ids $VPC_ID \
    --traffic-type ALL \
    --log-destination-type cloud-watch-logs \
    --log-group-name hitc-flow-logs \
    --max-aggregation-interval 600 \
    --tag-specifications 'ResourceType=vpc-flow-log,Tags=[{Key=Name,Value=hitc-flow-log}]' \
    --deliver-logs-permission-arn 'arn:aws:iam::690634326977:role/hitc-cw-flow-logs'
# Watch for initial flow logs
printf "Waiting for the flow logs to appear in CW Logs Group "
START_TIMER=$(date +%s)
TEST=""
while [ -z "$TEST" ] ; do
  printf "."
  sleep 20
  TEST=$(aws logs describe-log-streams --log-group-name hitc-flow-logs --output text)
done
STOP_TIMER=$(date +%s)
echo "DONE"
echo $((STOP_TIMER-START_TIMER))" seconds have elapsed"
Tear down TEST 2
To re-run the test, delete the flow log and reset the CW Logs Group.
# Delete the Flow Logs for the VPC
FLOW_LOG_ID=$(aws ec2 describe-flow-logs --filter "Name=resource-id,Values=$VPC_ID" --query 'FlowLogs[0].FlowLogId' --output text)
echo $FLOW_LOG_ID
aws ec2 delete-flow-logs --flow-log-ids $FLOW_LOG_ID
# Delete and Recreate the CW Logs Group
aws logs delete-log-group --log-group-name hitc-flow-logs
aws logs create-log-group --log-group-name hitc-flow-logs
Final Cleanup TEST 2
And when we are all done, we can run the following commands to delete the role and associated policy. But hold off for now as we will need this role for Test 3.
# CLI commands to tear down the role and IAM policy
aws iam detach-role-policy --role-name hitc-cw-flow-logs --policy-arn "arn:aws:iam::$ACCOUNT:policy/hitc-cw-flow-logs"
aws iam delete-role --role-name hitc-cw-flow-logs
aws iam delete-policy --policy-arn "arn:aws:iam::$ACCOUNT:policy/hitc-cw-flow-logs"
TEST 2 Summary
| Script Results | Minutes |
|---|---|
| 21 seconds have elapsed | 0.35 Minutes |
| 541 seconds have elapsed | 9.02 Minutes |
| 522 seconds have elapsed | 8.70 Minutes |
| 375 seconds have elapsed | 6.25 Minutes |
This is much better, but it can still take up to 10 minutes and is somewhat variable.
OBJECTIVE 3: Experimentally determine the typical delay for ongoing traffic to be captured in the flow log record.
Now, onto what is probably the most interesting and has the biggest implications for security monitoring. We want to know how long will it take for traffic that occurs in my VPC to show up as recorded in my flow logs? In other words, “I want to know how much lag there is in any detective control that I implement (that is based on flow logs).”
The security implications of this are fairly significant.
The Problem Statement
Wouldn’t it be great to time stamp a packet, send it across the virtual network of our VPC, look at the packet in CloudWatch Logs, and determine how much delay there was between the time the packet was sent, and when it was recorded?
That would be fantastic. The only problem is that a flow log contains only metadata, and not any payload. Here is a screenshot of what we have to work with:
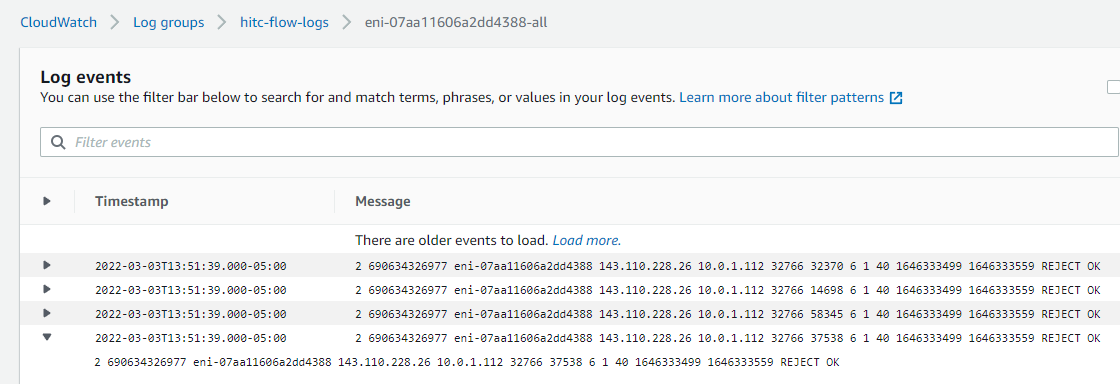
As it turns out, about the only thing that we have to fiddle with is the Source port and the Destination port. So, I will use the source port to encode the timestamp and send it to an unchanging port (TCP port 7777) at a target IP address outside of my VPC.
Will this work?
Let’s do some math here. We know that there are 65536 (2 to the power of 16) possible TCP ports.
If we send one packet per second from a different port, we could do that for 1092 Minutes:
>>> (2 ** 16) / 60
1092.2666666666667
Or converting that to hours:
>>> (2 ** 16) / 60 / 60
18.204444444444444
We get 18 hours. Hence, we can send traffic at a rate of one packet per second from a unique source port for over 18 hours before using up all possible ports!
Converting back and forth from the source port to the epoch time
To calculate which port to use, we will take the current epoch time and divide it by 65536 and then take the integer portion of the remainder and use that for the source port. The math function that returns the remainder is called “modulo” and is represented as a % in python
source port = int(current_epoch_time % 65536)
To convert back to the epoch time from the source port, take the current epoch time and divide it by 65536 and then keep the quotient portion. Divide the source port by 65536 and take that result and add it to the quotient. Multiply the new total by 65536 and the new result is the epoch time of when the data was sent.
epoch_timestamp = int((modulo / 65536.0 + int(current_epoch_time / 65536)) * 65536)
This conversion assumes that the current epoch time is within the 18 hour window represented by the source port value.
Introducing Scapy
To generate a packet per second with an ever increasing source port that represents the time that the packet was sent, I used scapy. Scapy is written as a python module and is ideal for programmatically crafting packets.
As we will be running Scapy on our EC2 instance to send traffic out of our VPC, we need to install Scapy, its dependencies, and the additional modules my python program will use:
sudo apt update
sudo apt install -y python3-pip tcpdump  python3-matplotlib
sudo pip3 install pytz
sudo pip install --pre scapy[complete]
Note that using sudo with pip to install software is generally a bad idea. See this link for a detailed discussion of the security issues.
However, in this case, Scapy needs to run as root to be able to send packets, and we will destroy our EC2 instance at the end of our experimentation.
To launch Scapy, just type sudo scapy at the Ubuntu command line as shown below:
ubuntu@ip-10-0-1-112:~$ sudo scapy
INFO: PyX dependencies are not installed ! Please install TexLive or MikTeX.

                     aSPY//YASa
             apyyyyCY//////////YCa       |
            sY//////YSpcs  scpCY//Pp     | Welcome to Scapy
 ayp ayyyyyyySCP//Pp           syY//C    | Version 2.4.5
 AYAsAYYYYYYYY///Ps              cY//S   |
         pCCCCY//p          cSSps y//Y   | https://github.com/secdev/scapy
         SPPPP///a          pP///AC//Y   |
              A//A            cyP////C   | Have fun!
              p///Ac            sC///a   |
              P////YCpc           A//A   | We are in France, we say Skappee.
       scccccp///pSP///p          p//Y   | OK? Merci.
      sY/////////y  caa           S//P   |             -- Sebastien Chabal
       cayCyayP//Ya              pY/Ya   |
        sY/PsY////YCc          aC//Yp
         sc  sccaCY//PCypaapyCP//YSs
                  spCPY//////YPSps
                       ccaacs
                                       using IPython 8.1.1
>>>
I set up a target VM in another VPC with the security group set to allow inbound TCP port 7777 from the system with Scapy installed. As a test, I am running TCPdump on the target machine, using the following command:
sudo tcpdump -i eth0 'port 7777'
Next, use Scapy to send the target a packet. Enter the following commands at the Scapy IPython prompt, but substitute my target IP address (35.168.8.211) for the one you are using:
ip=IP(dst="35.168.8.211")
tcp=TCP(sport=1111,dport=7777,flags="S",options=[('Timestamp',(0,0))])
pay="This is Test3"
test3=ip/tcp/pay
send(test3)
The result should look like:
.
Sent 1 packets.
NOTE: If you get a “Operation not permitted” error, you forgot to run Scapy as root
Exit back to the Ubuntu command line using exit()
Looking over at the target system, we can see that TCPdump generated the following two records:
22:25:43.461121 IP ec2-34-201-148-40.compute-1.amazonaws.com.1111 > ip-172-31-48-150.ec2.internal.7777: Flags [S], seq 0:13, win 8192, options [TS val 0 ecr 0,eol], length 13
22:25:43.461156 IP ip-172-31-48-150.ec2.internal.7777 > ec2-34-201-148-40.compute-1.amazonaws.com.1111: Flags [R.], seq 0, ack 14, win 0, length 0
We Sent a TCP “Syn” packet and a “Reset” was sent back because there is not a service listening on port 7777.
Putting the theory to work
Ok, so now that we know the Scapy commands to craft a packet. We can write a program to determine the Source Port to use, to craft the packet and sent it. We also can prove that the packet was received by the target system and see the timestamp printed to standard out by TCPdump.
The program is called generate-test-traffic.py and can be downloaded from my Github Repo
Copy this program to the EC2 instance that has Scapy Installed.
wget https://raw.githubusercontent.com/Resistor52/hitc-benchmark-flow-logs/hitc-ep18/generate-test-traffic.py
Run the program as root using
sudo python3 ./generate-test-traffic.py
Once the program runs, it will ask four questions as shown below and then start to send packets at a rate of one per second.
ubuntu@ip-10-0-1-112:~$ sudo python3 ./generate-test-traffic.py
Enter the name for the CSV log file (without the csv extension): test3A
Enter the desired target IP aggress in the format "111.111.111.111": 35.168.8.211
Enter the desired start time in the format "HH:MM" for local time zone: 19:00
Enter the desired end time in the format "HH:MM" for local time zone: 22:00
Traffic generation will start at: 19:00
Traffic generation will continue until: 22:00
**************** Start of Traffic **************************
.Epoch Time: 1646344800   Time: 2022-03-03 22:00:00 UTC+0000   srcPort: 14944   Remaining Time: 0 Seconds
***************** End of Traffic ***************************
In the example above, I am calling the log file test3A and provided 35.168.8.211 as the target IP. (Again, be sure to use the IP address of the target that you set up and has TCPdump listening.) I started the program at 19:00 hours UTC, simply because that was on the hour, and had it run for 3 hours, ending at 22:00. The program uses UTC because that is the time zone that AWS uses for all its cloud services, including EC2.
Now, while we are waiting for the traffic generation to start, rerun TCPdump on the target system, this time capturing the packets to a file:
sudo tcpdump -i eth0 'port 7777' -w tcpdump.pcap
Initial Look at the Data
The generate-test-traffic.py script created a log, which I named test3A.csv. Note that the script adds the “csv” extension to the filename. The top 10 rows of the file are shown below:
"Epoch_Time","Date_Time","Source_Port"
"1646334000","2022-03-03 19:00:00 UTC+0000","4144"
"1646334001","2022-03-03 19:00:01 UTC+0000","4145"
"1646334002","2022-03-03 19:00:02 UTC+0000","4146"
"1646334003","2022-03-03 19:00:03 UTC+0000","4147"
"1646334004","2022-03-03 19:00:04 UTC+0000","4148"
"1646334005","2022-03-03 19:00:05 UTC+0000","4149"
"1646334006","2022-03-03 19:00:06 UTC+0000","4150"
"1646334007","2022-03-03 19:00:07 UTC+0000","4151"
"1646334008","2022-03-03 19:00:08 UTC+0000","4152"
We can look at the first 10 packets received by the Target system using the following tcpdump command:
tcpdump -r tcpdump.pcap -nn -c10 'dst port 7777'
And the output is:
19:00:00.013928 IP ec2-34-201-148-40.compute-1.amazonaws.com.4144 > ip-172-31-48-150.ec2.internal.7777: Flags [S], seq 0:13, win 8192, options [TS val 0 ecr 0,eol], length 13
19:00:01.018892 IP ec2-34-201-148-40.compute-1.amazonaws.com.4145 > ip-172-31-48-150.ec2.internal.7777: Flags [S], seq 0:13, win 8192, options [TS val 0 ecr 0,eol], length 13
19:00:02.023309 IP ec2-34-201-148-40.compute-1.amazonaws.com.4146 > ip-172-31-48-150.ec2.internal.7777: Flags [S], seq 0:13, win 8192, options [TS val 0 ecr 0,eol], length 13
19:00:03.027319 IP ec2-34-201-148-40.compute-1.amazonaws.com.4147 > ip-172-31-48-150.ec2.internal.7777: Flags [S], seq 0:13, win 8192, options [TS val 0 ecr 0,eol], length 13
19:00:04.032328 IP ec2-34-201-148-40.compute-1.amazonaws.com.4148 > ip-172-31-48-150.ec2.internal.7777: Flags [S], seq 0:13, win 8192, options [TS val 0 ecr 0,eol], length 13
19:00:05.050076 IP ec2-34-201-148-40.compute-1.amazonaws.com.4149 > ip-172-31-48-150.ec2.internal.7777: Flags [S], seq 0:13, win 8192, options [TS val 0 ecr 0,eol], length 13
19:00:06.061365 IP ec2-34-201-148-40.compute-1.amazonaws.com.4150 > ip-172-31-48-150.ec2.internal.7777: Flags [S], seq 0:13, win 8192, options [TS val 0 ecr 0,eol], length 13
19:00:07.066456 IP ec2-34-201-148-40.compute-1.amazonaws.com.4151 > ip-172-31-48-150.ec2.internal.7777: Flags [S], seq 0:13, win 8192, options [TS val 0 ecr 0,eol], length 13
19:00:08.071536 IP ec2-34-201-148-40.compute-1.amazonaws.com.4152 > ip-172-31-48-150.ec2.internal.7777: Flags [S], seq 0:13, win 8192, options [TS val 0 ecr 0,eol], length 13
19:00:09.077085 IP ec2-34-201-148-40.compute-1.amazonaws.com.4153 > ip-172-31-48-150.ec2.internal.7777: Flags [S], seq 0:13, win 8192, options [TS val 0 ecr 0,eol], length 13
We can extract the two critical data elements from packet capture using the following command:
tcpdump -r tcpdump.pcap -nn -c10 'dst port 7777' | cut -d" " -f1,3 | cut -d"." -f1,6 | tr "." " "
And this command will output the timestamp and the source port of the packet received by the target system:
19:00:00 4144
19:00:01 4145
19:00:02 4146
19:00:03 4147
19:00:04 4148
19:00:05 4149
19:00:06 4150
19:00:07 4151
19:00:08 4152
19:00:09 4153
Great, everything correlates! Now lets write the whole packet to a file:
tcpdump -r tcpdump.pcap -nn 'dst port 7777' | cut -d" " -f1,3 | cut -d"." -f1,6 | tr "." " " > test3A.log
We will save test3A.log for later, as it will come in handy.
Looking in CloudWatch Logs
The CloudWatch Logs Web Console is a great tool to slice and dice log data. Paste in the following query:
fields @ingestionTime, @timestamp, ((toMillis(@ingestionTime) - toMillis(@timestamp))/1000) as IngestDelaySecs, ((toMillis(@ingestionTime) - toMillis(@timestamp))/1000/60)
as IngestDelayMins, toMillis(@timestamp)/1000 as TimeStampEpoch, (65536*floor(TimeStampEpoch/65536))+srcPort as SentTimeEpoch, fromMillis(SentTimeEpoch * 1000) as SentTime,
TimeStampEpoch-SentTimeEpoch as TimeStampDelaySec, srcPort
| sort srcPort asc
| limit 10000
| filter srcAddr = "10.0.1.112" and dstAddr = "35.168.8.211" and dstPort != "22" and srcPort != "22")
Be sure to set the time filter in the upper window to include the window in which the packets were sent.
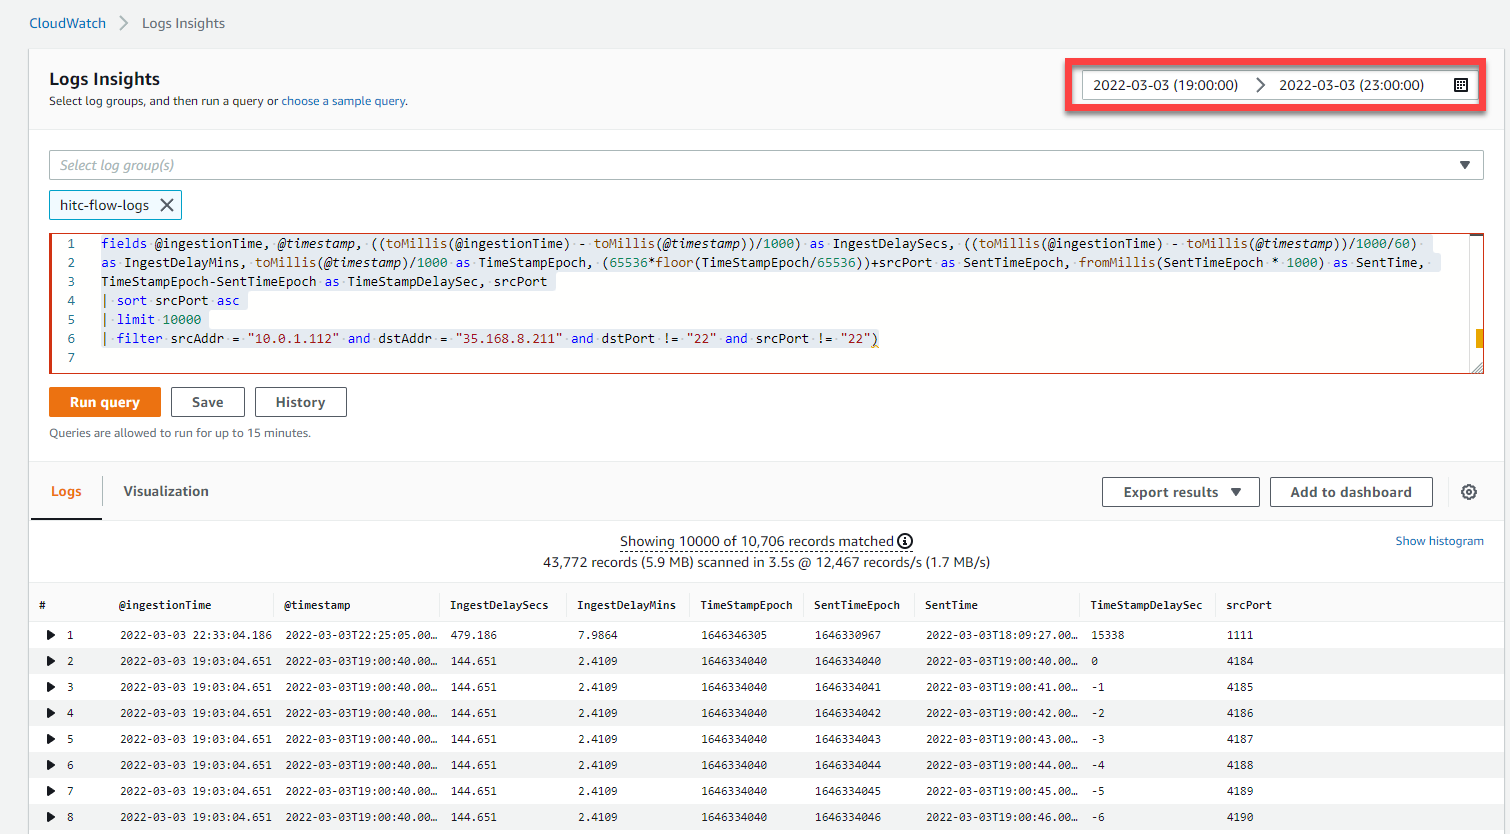
Looking at the output, we see that AWS provides two fields @ingestionTime and @timestamp so we can calculate the delay the Ingestion Delay Seconds (IngestDelaySecs) by converting both time values to Epoch time and subtracting them.
But how accurate is the timestamp? Well, we can use the CloudWatch Logs Query Language to calculate a SentTimeEpoch based on the srcPort. We can also convert that to SentTime so it is human-readable. If we subtract the SentTimeEpoch from the TimeStampEpoch we get the TimeStampDelaySec.
Disregard the first record as that was captured when I demonstrated how to use Scapy with IPython using an arbitrary source port. (I generated the traffic using the Python Script a few hours beforehand and that explains the chronology of this timestamp.) This record will be removed from the downloaded dataset.
Another thing, that you may have noticed in the screenshot, is that the first srcPort is 4184 which is 40 seconds after we sent the packet with srcPort 4144!
Very interesting. It looks like we have “negative delays.” or to phrase it more accurately, the @timestamp value attached by AWS has an error that fluctuates within a range.
Use the “Export Results” button to save the file as logs-insights-results.csv
Looking at the Data Graphically
Since we see that we have an Ingest Delay and a Timestamp Error, it would be good to look at this data graphically. Toward that end, I have create a python program called plotObservations.py which can be downloaded from my Github Repo.
Copy this program to the EC2 instance that has Scapy Installed.
wget https://raw.githubusercontent.com/Resistor52/hitc-benchmark-flow-logs/hitc-ep18/plotObservations.py
Run the program as using:
python3 ./plotObservations.py
The program will read logs-insights-results.csv and will generate the four plots shown below.
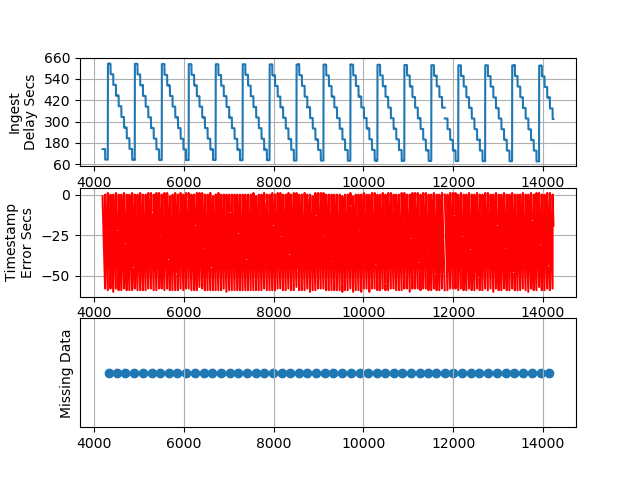
 PLOT 1 - Packets 1000 to 2000
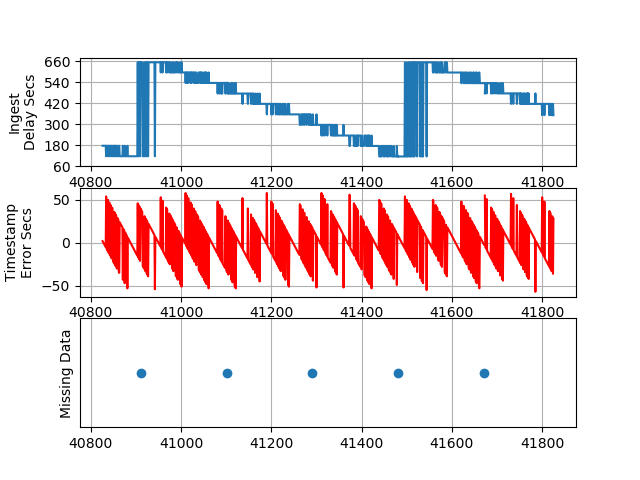
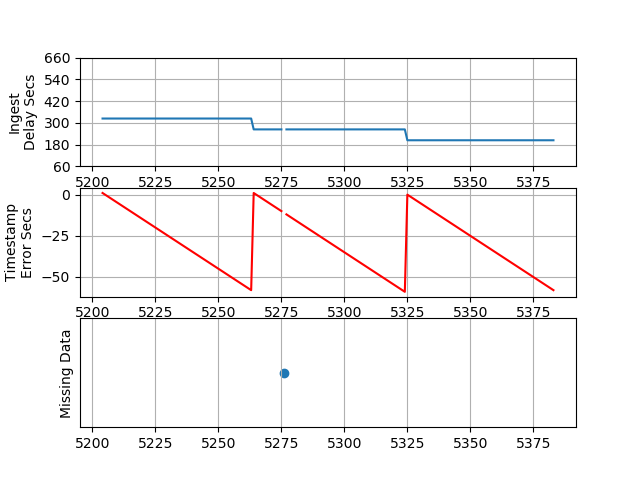 PLOT 2 - Packets 1020 to 1200
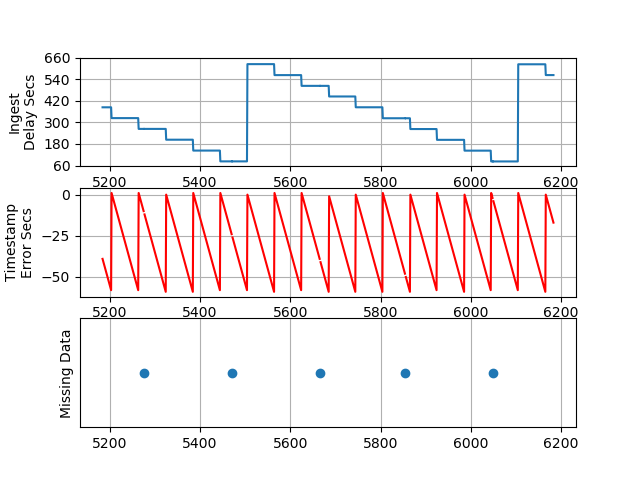
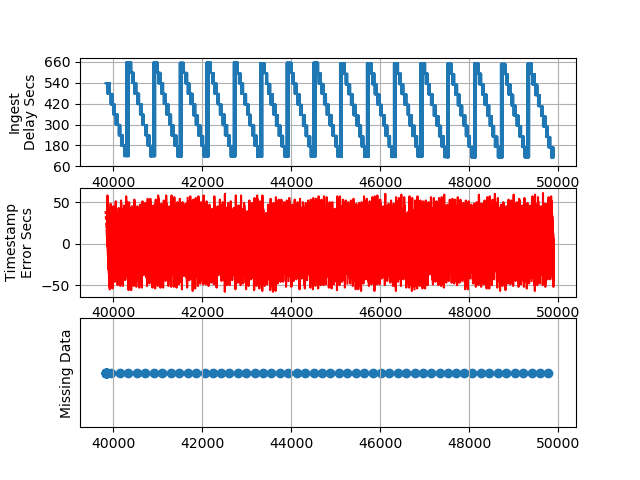
 PLOT 3 - The First 10,000 Packets
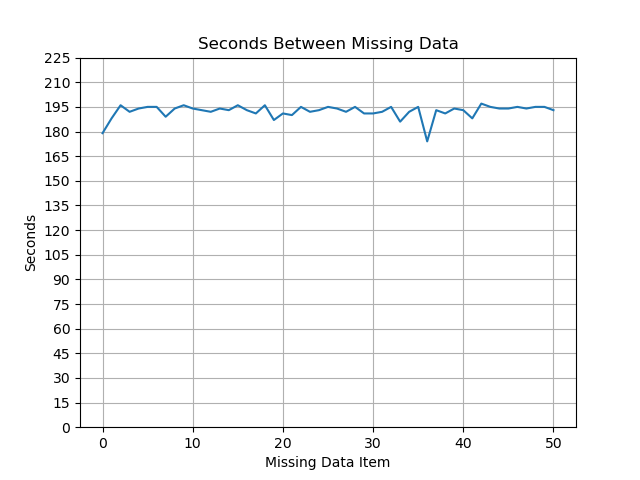 Delta - Seconds Between Missing Data
I saved the charts generated from data captured in the exact same manner 24 hours prior to this set, and those are shown below for comparison purposes.
 PLOT 1b - Packets 1000 to 2000 (Previous Run)
 PLOT 3b - The First 10,000 Packets (Previous Run)
Observations
Ingest Delay - We can see the ingest delay varies from a little over 60 seconds to almost 11 minutes every 10 minutes. Note that when we configured the flow logs we used a setting of max-aggregation-interval 600. This test should be repeated using a max-aggregation-interval 60 to measure the impact on the Ingest Delay.
Timestamp Error Seconds - The TimeStampDelaySec is calculated by subtracting the SentTimeEpoch from TimeStampEpoch. Chronologically, the SentTimeEpoch should occur first, as that is the timestamp of when Scapy sent the packet. Similarly, the TimeStampEpoch is when the VPC Flow Logs system detects the packet on the virtual network. I expected the error to be within milliseconds, but not almost a whole minute off! I am not sure how to explain this. At first, I thought that it might be a math error on my part. But we can take a look at a single packet as it was:
- Recorded in the flow log (logs-insights-results.csv),
- Sent by Scapy (test3A.csv), and
- Recorded by TCPdump at the Target System (tcpdump.pcap)
We can use grep -E ',-58,|srcPort' logs-insights-results.csv | head -n6 | cut -d"," -f5,6-9 to generate the following table:
| TimeStampEpoch | SentTimeEpoch | SentTime | TimeStampDelaySec | srcPort |
|---|---|---|---|---|
| 1646334040 | 1646334098 | 2022-03-03 19:01:38.000 | -58 | 4242 |
| 1646334099 | 1646334157 | 2022-03-03 19:02:37.000 | -58 | 4301 |
| 1646334160 | 1646334218 | 2022-03-03 19:03:38.000 | -58 | 4362 |
| 1646334219 | 1646334277 | 2022-03-03 19:04:37.000 | -58 | 4421 |
| 1646334280 | 1646334338 | 2022-03-03 19:05:38.000 | -58 | 4482 |
Selected packets from logs-insights-results.csv
Now that we have identified the first five packets with the highest error (-58), we can look for those packets in the log generated by Scapy using grep -E '"4242"|"4301"|"4362"|"4421"|"4482"' test3A.csv
| Epoch_Time | Date_Time | Source_Port |
|---|---|---|
| 1646334098 | 2022-03-03 19:01:38 UTC+0000 | 4242 |
| 1646334157 | 2022-03-03 19:02:37 UTC+0000 | 4301 |
| 1646334218 | 2022-03-03 19:03:38 UTC+0000 | 4362 |
| 1646334277 | 2022-03-03 19:04:37 UTC+0000 | 4421 |
| 1646334338 | 2022-03-03 19:05:38 UTC+0000 | 4482 |
Selected packets from test3A.csv
We can see that the SentTimeEpoch as calculated by my CloudWatch query logic is performed correctly as it matches the Epoch_Time as logged by Scapy.
For completeness, let’s look at TCP dump:
tcpdump -tt -nn -r tcpdump.pcap 'src port 4242 or src port 4301 or src port 4362 or src port 4421 or src port 4482' | cut -d":" -f1
produces:
1646334098.569321 IP 34.201.148.40.4242 > 172.31.48.150.7777
1646334157.873827 IP 34.201.148.40.4301 > 172.31.48.150.7777
1646334218.182541 IP 34.201.148.40.4362 > 172.31.48.150.7777
1646334277.489424 IP 34.201.148.40.4421 > 172.31.48.150.7777
1646334338.805517 IP 34.201.148.40.4482 > 172.31.48.150.7777
As expected, we can see that the epoch time recorded by TCPdump matches the other observations in the tables above.
Missing Data - Looking at the Missing Data plots in the figures above initially raised some concerns. Is the VPC dropping packets? To investigate what is going on, I tweaked plotObservations.py to generate the “Delta” plot to show the periodicity of the missing data as well as to output the srcPorts for which data is missing. That output is shown below:
The following srcPorts are missing:
[4327, 4506, 4694, 4890, 5082, 5276, 5471, 5666, 5855,
6049, 6245, 6439, 6632, 6824, 7018, 7211, 7407, 7600,
7791, 7987, 8174, 8365, 8555, 8750, 8942, 9135, 9330,
9524, 9716, 9911, 10102, 10293, 10485, 10680, 10866,
11058, 11253, 11427, 11620, 11811, 12005, 12198, 12386,
12583, 12778, 12972, 13166, 13361, 13555, 13750, 13945,
14138]
I also had plotObservations.py write the ports to a file, missingSrcPorts.csv so that we can grep for them:
grep -f missingSrcPorts.csv test3A.csv
Hmm, none of the missing srcPorts were logged by Scapy. The good news is that the VPC network did not drop any packets because all sent packets have been accounted for. The bad news is that there is bug in generate-test-traffic.py that occurs about every 195 seconds. I suspect that it is an issue with my generateTraffic function, most likely due to inaccuracies with time.sleep() compounded by variations in the amount of time it takes Scapy to write the packet out to the network.
def generateTraffic(stop_time_epoch):
    datetime_TZ = datetime.now(tz_TZ)
    seconds = int(time.time())             # Current Epoch Time
    modulo = seconds % (2 ** 16)           # Calculate the SrcPort
    datetime_time=datetime_TZ.strftime("%Y-%m-%d %H:%M:%S %Z%z")
    print(f"Epoch Time: {seconds}   Time: {datetime_time}   srcPort: {modulo}   {RemainingTimeString(stop_time_epoch)}      ", end = "\r")
    write_str='"'+str(seconds)+'","'+datetime_time+'","'+str(modulo)+'"\n'
    f.write(write_str)
    tcp=TCP(sport=modulo,dport=7777,flags="S",options=[('Timestamp',(0,0))])
    pay=logfile+" - "+str(modulo)
    # Trap the output of scapy send so it does not print to console
    state = sys.stdout
    sys.stdout = open('/dev/null', 'w')
    send(ip/tcp/pay)                        # Scapy
    sys.stdout.close()
    sys.stdout = state
    # Wait one second between packets
    time.sleep(1)
    return
OBJECTIVE 4 - Contemplate the implications of our findings
Tests 1 and 2 demonstrate that we need to budget ample time ( at least 16 minutes) to allow AWS to provision the flow logs. We observed that flow logs sent to CloudWatch Logs provision faster than logs sent to a S3 bucket.
Test 3 demonstrated that with a max-aggregation-interval set to “600,” it is possible to see an ingestion delay of up to 10.42 minutes (cat logs-insights-results.csv | cut -d"," -f4 | sort -u -n | tail -n1) and that it is a function of how long ago the last aggregation occurred. The minimum ingestion delay was 1.26 minutes (cat logs-insights-results.csv | cut -d"," -f4 | sort -u -n | head -n2). Lots of bad stuff could be detected late if you were expecting to use flow logs for real-time detection. I think that AWS would tell you that is not the use case that they were designed for. Instead use something like a Web Application Firewall (WAF).
We observed an unaccounted-for error in the ‘@timestamp’ field generated by Cloud Watch Logs Insights of +1 to -60 seconds during our test and +60 to -58 during a previous test. This demonstrates the value of benchmarking critical security systems.
In this experiment, we demonstrated a novel technique for timestamping packets that will be reduced to a flow log by using the source port field. We showed how to verify the accuracy of the technique by comparing the epoch time calculated from the source port with the time logged by TCPdump.
We also demonstrated how to identify any missing packets using this technique and in the process identified a minor bug in generate-test-traffic.py that caused a packet not to be sent about every 195 seconds. This demonstrates (again) the importance of understanding the limitations of the security tools that we use. At some point, I will circle back and fix this bug.
Remember that the limited amount of testing that was performed is not sufficient to draw too many conclusions. Tests 1 and 2 should be repeated multiple times at different times of day, over the course of several days, in different regions to get more precise statistics. Test 3 should be repeated multiple times and should consider the impact of changing the max-aggregation-interval setting. The more the testing process is automated the lower the burden of repeating each test. But, I think that I have taken this little experiment far enough for now.
Wrap Up
Wow, we covered quite a bit in this Episode:
- We made extensive use of the AWS CLI
- We used a Bash “while loop” to time AWS CLI calls
- We crafted packets using Scapy and read those packets using TCPdump.
- We also created a fairly sophisticated CloudWatch Logs Insights query, and
- Learned how we can use Python to visualize data.
To learn more about TCPdump, Scapy, and packet crafting check out SANS SEC503: Intrusion Analysis In-Depth. To learn more about using Python to create security tools like generate-test-traffic.py consider SANS SEC573: Automating Information Security with Python.
Closing Comments
If you have thoughts or comments on today’s episode, feel free to chime in on the comments for this YouTube video.
If you appreciate this video and want to see more like it, be sure to give it a “thumbs up.”
Stay tuned for another installment of “Head in the Clouds” as announcements of new episodes are made on the SANS Cloud Security Twitter feed.
Meanwhile, be sure to check out the other great videos on the SANS Cloud Security YouTube Channel.
Take care.